I write articles informed by data on topics from science to culture.
For the BBC, I’ve used sentiment analysis to trace the emotional arcs of six story plots, queried Spotify’s web API to find the saddest number one song and dug into the data around South Korea’s startlingly low fertility rate, as well as crunching the numbers behind BBC Culture’s regular film, TV and book polls.
I’ve worked with commercial studios like Quartz Creative, The Economist Brand Connect, BBC Storyworks, and Beyond Words to craft data stories, reports, and thought leadership pieces for global brands like Siemens, Dell and SAP Concur. And I’ve worked extensively with large surveys and other datasets to find original insights – as in my piece for infogr8 on stray dogs and cats.
Read more of my writing.
Stories

The Terrible Toll of Autoimmune Diseases, with Jen Christiansen for Scientific American

The Father of Environmental Justice Exposes the Geography of Inequity, with Jen Christiansen for Scientific American

When Does Spring Begin? With Valentina D'Efilippo for BBC Science Focus

When Does Spring Begin? With Valentina D'Efilippo for BBC Science Focus

Charting Pet Homelessness with Mars Petcare, for infogr8. Graphic: Martina Zunica

Charting Pet Homelessness with Mars Petcare, for infogr8. Graphic: Martina Zunica
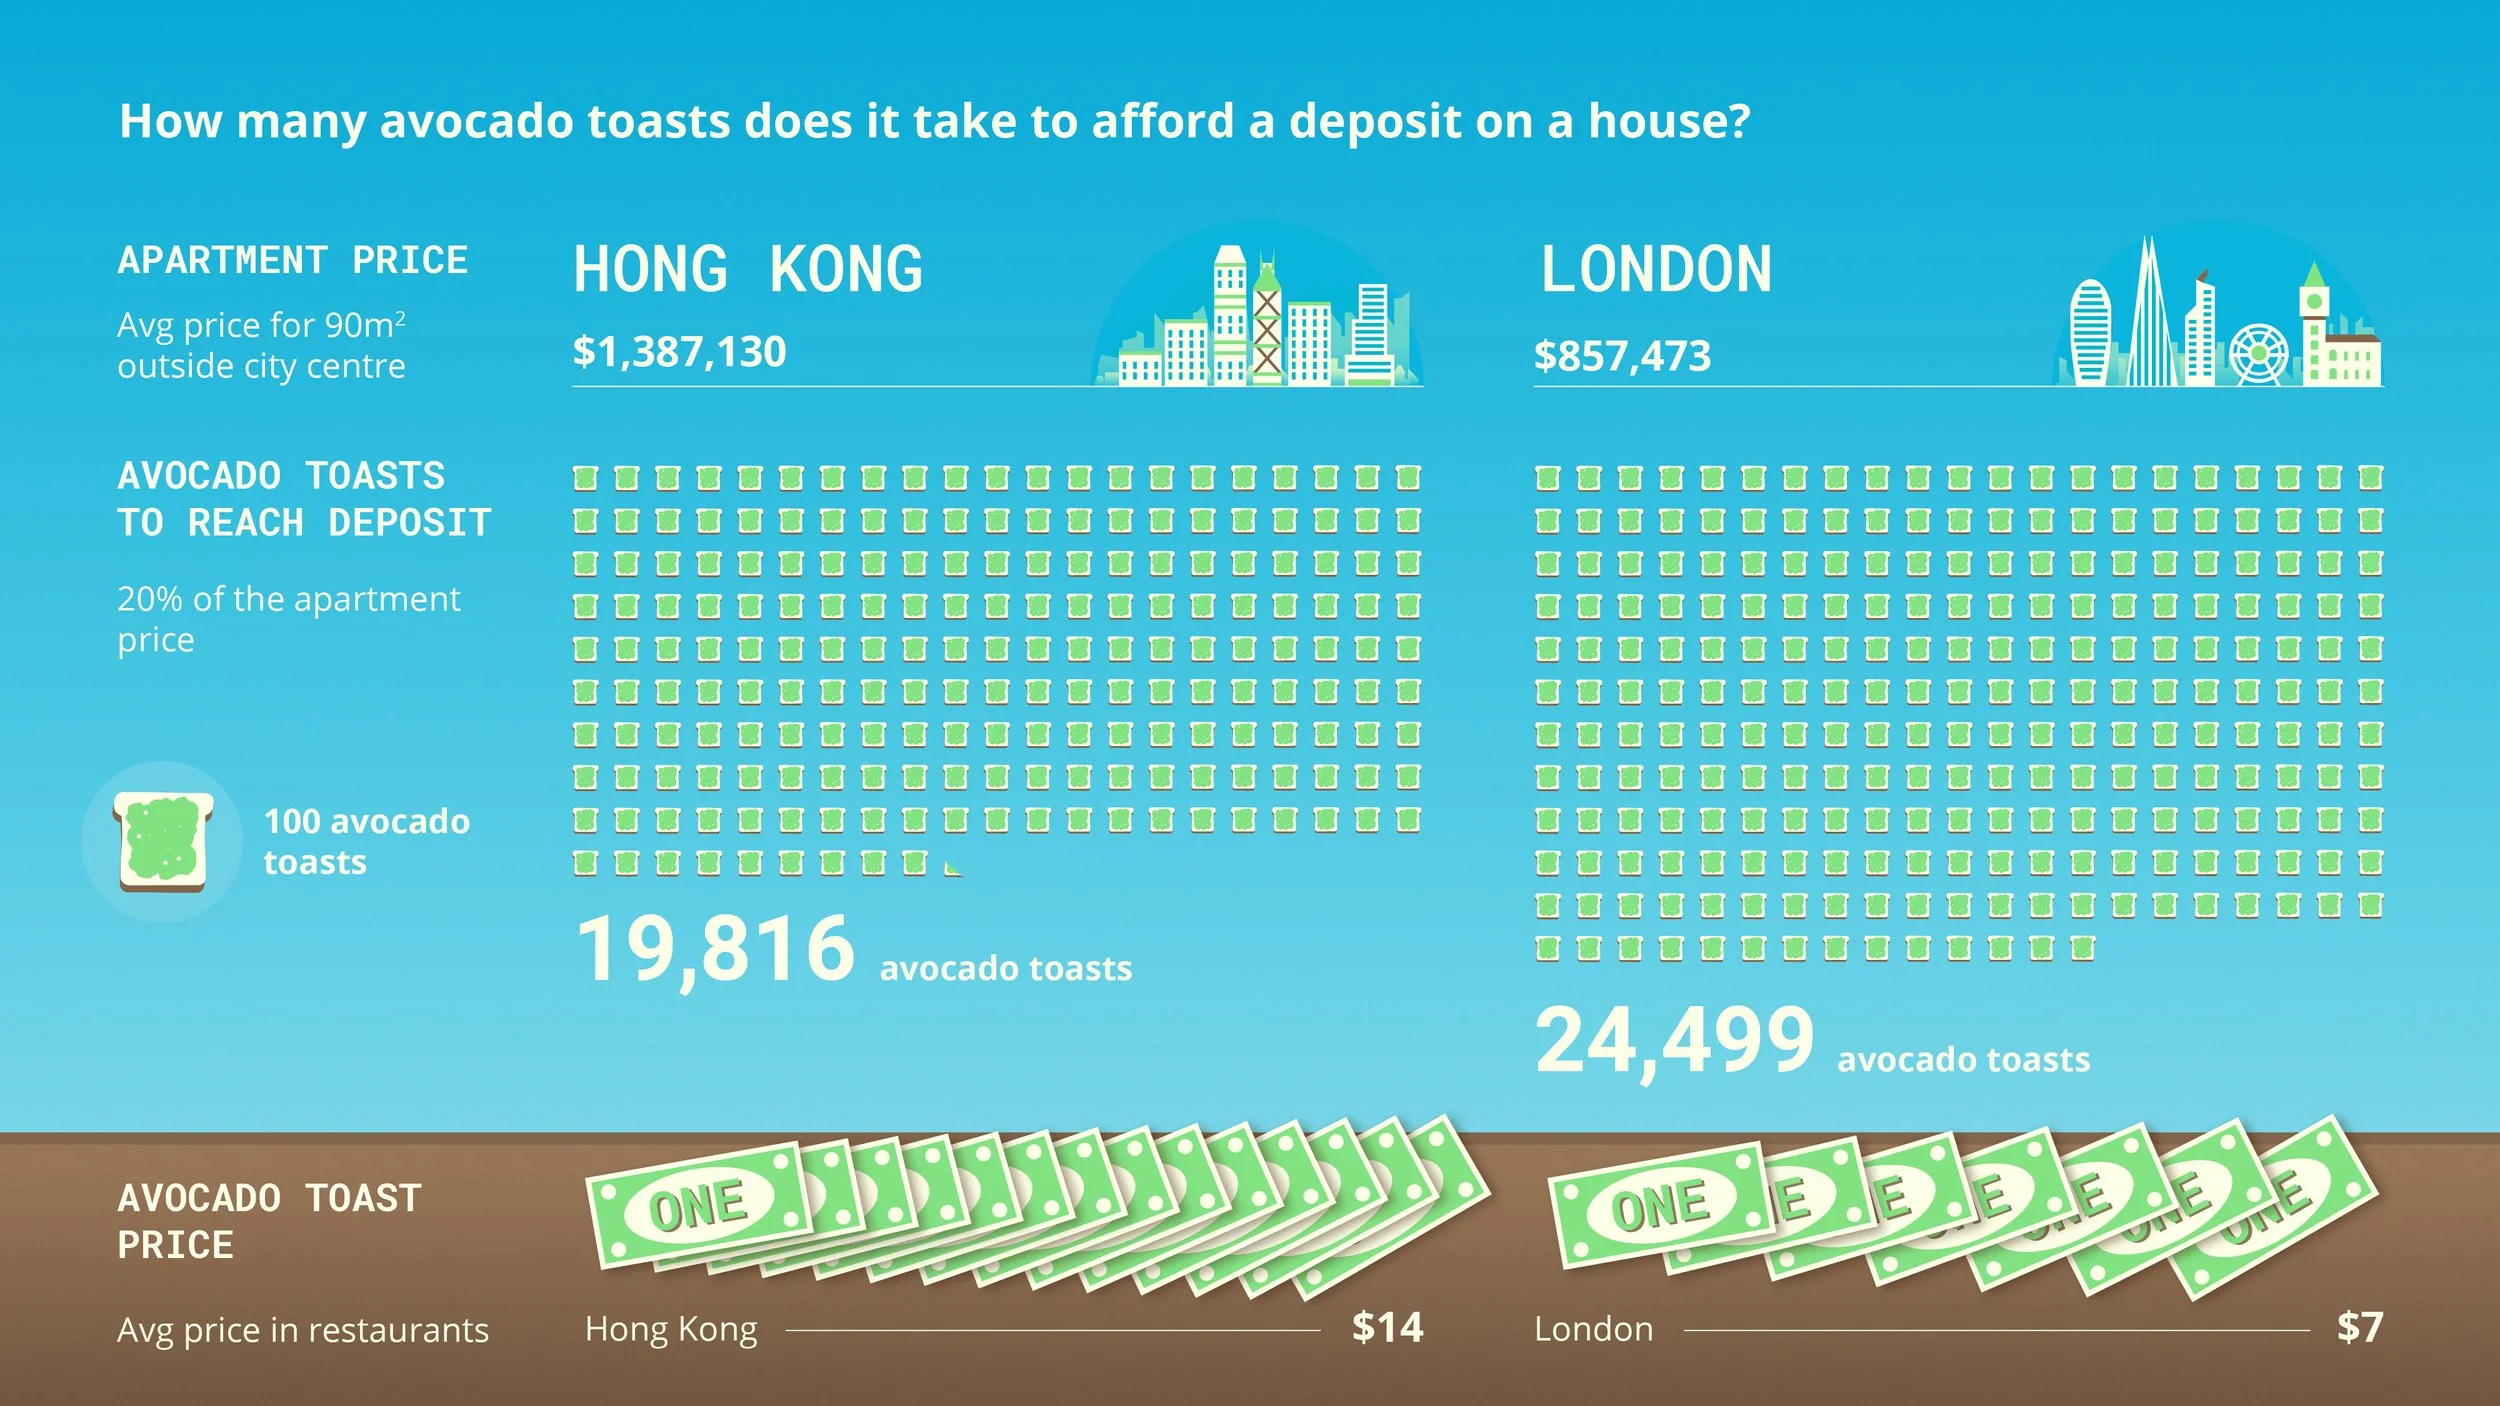
How Many Avocado Toasts Does It Take to Afford a Deposit on a House? With Piero Zagami for BBC

Discrimination is Breaking People's Hearts, with Amanda Montañez for Scientific American

The Cost of Changing an Entire Country's Alphabet, with Piero Zagami for BBC

Gender in Opera, with Stefanie Posavec for La Lettura
Making good data visual
I work on information graphics and data visualisations, primarily as a journalist, data analyst, researcher and editor. I create graphics using data visualisation tools like R ggplot, Flourish and Datawrapper, write animation scripts, and craft text for graphics and dashboards.
I’m particularly interested in environmental and health topics. I’ve tracked the terrible toll of autoimmune diseases, the deadly burden of discrimination and the hidden patterns in folk songs for Scientific American. I’ve dug into the numbers behind the fragile state of the climate and investigated the impact on Olympic athletes of extreme heat for BBC Future, and I’ve charted the planetary impact of a Thanksgiving feast for Sentient.
I’ve worked for numerous organisations in the civil society and non-profit space, notably around climate and sustainability, including Data4Change (as their senior researcher), Possible, Rothamsted Research, Zoological Society of London (ZSL), Rethinking Economics and Laudes Foundation.